• Asia overtakes Europe as home to the second largest population of
ultra-wealthy people
Bucharest, 15th of March – Knight Frank, the leading independent global property consultancy, has launched The Wealth Report, the most prestigious study on global wealth. This year’s edition shows that the number of ultra-wealthy people (those with net assets of US$50 million or more) rose by 10% in 2017 – taking the global population to 129,730, with a combined worth of US$26.4 trillion.
The data provided by Wealth-X highlights that the ultra-wealthy population grew at a notably more rapid rate in 2017 than in the previous five years, when there was a cumulative 18% increase. This trend in wealth creation mirrors the growing momentum of the global economy since the start of 2017. Solid forecasts for the global economy underpin the wealth specialist’s prediction that the number of individuals with net assets of US$50 million or more will have grown by a further 40% by 2022.
When looking at how specific ultra-wealthy populations have fared between 2012 and 2017, the picture is mixed. While the number of people with US$50 million or more in net assets rose in North America (+31%), Asia (+37%) and Europe (+10%), there were falls in the remaining five regions, most notably in Latin America and the Caribbean (-22%) and Russia and CIS (-37%).
North America remains the world’s largest wealth region – some 34% of the world’s ultra-wealthy are based there. The country’s ultra-wealthy population increased by a further 5% last year, taking the total number to 44,000.
Europe, however, narrowly lost its second place spot to Asia, despite a 10% rise over the past year in the number of Europeans with US$50 million or more, taking its total to 35,180. A 15% rise in Asia’s ultra-wealthy cadre took its population to 35,880, according to Wealth X.
The data also showed that the number of people with $5 million or more in net assets around the world rose by 9% in 2017, with the number of ‘demi-billionaires’, those with $500m or more in net assets, climbing by 11%. Romania has 13% more millionaires ($5 mil or more in net assets), their number reaching 3.720 individuals in 2017, and forecast for 2022 is a growth to 5.630 individuals.
Wealth-X’s methodology for calculating looks into GDP growth, the performance of stock markets and other investments, as well as wealth distribution trends. Currency also plays a significant role. The wealth data is shown in US dollars, and, as a result, the movement of local currencies against the dollar has also had an impact.
The market for mega deals is changing rapidly. Last year, private investors made up 43% of commercial transactions valued at US$1billion and above, greater than the 31% accounted for by Institutional investors.
The past five years have seen a 300% increase in total number of US$1bn plus deals per annum moving from US$5 billion in 2012 to a total of US$20 billion in 2017.
The Knight Frank Luxury Investment Index (KFLII) has risen in value by 7% over the 12 months to the end of Q4 2017.
The asset leading the index at the end of 2017 was art, which saw outstanding growth of 21% over the course of the year (Art Market Research (AMR) data). This strong performance follows a number of years when art had fallen behind other asset classes such as classic cars and wine. But last year’s record-breaking sale of Leonardo da Vinci’s Salvator Mundi for US$450million – surpassing the previous world record by a staggering US$271million – epitomises art’s recovery.
Record-breaking sales also took place for a number of the index’s other asset classes in 2017:
– In the classic car market, a 1956 Aston Martin DBR1, raced by Stirling Moss, sold at auction for US$22.5milion – a record for a British car
– Actor Paul Newman’s Rolex Daytona watch sold for US$17.8million, having been guided at US$1million
– Hong Kong jeweller Chow Tai Fook paid HK$553million for the Pink Star 59.6 carat vivid pink diamond – a world record for a diamond or piece of jewellery
– Estimated at £200,000, a set of four rare 16th or 17th century Chinese huanghuall chairs sold to an Asian buyer for £5.3million
To download the report, please click: http://www.knightfrank.com/wealthreport
Knight Frank Luxury Investment Index (to Q4 2017)
| Luxury asset | Price Growth | |
| 12-month | 10-year | |
| Art | 21% | 78% |
| Wine | 11% | 192% |
| Watches | 5% | 69% |
| Coins | 4% | 182% |
| Jewellery | 4% | 138% |
| Cars | 2% | 334% |
| Stamps | 1% | 103% |
| Coloured diamonds | 0% | 70% |
| Furniture | -1% | -32% |
| Chinese ceramics | -5% | -3% |
| KFLII** | 7% | 126% |
Notes: All data to Q4 2017
Sources: artmarketresearch.com (art, chinese ceramics, watches, jewellery), HAGI (classic cars), Wine Owners (wine) Stanley Gibbons (stamps, coins), Fancy Color Research Foundation (coloured diamonds). For methodology details please contact andrew.shirley@knightfrank.com
Reasons for buying luxury investments
| 1 | Joy of ownership |
| 2 | Capital appreciation |
| 3 | Safe haven for capital |
| 4 | Investment portfolio diversification |
| 5 | Status among peers |
Source: The Wealth Report Attitudes Survey 2018
Knight Frank City Wealth Index 2018
| Wealth | Investment | Lifestyle | Future | Overall rank | |
| New York | 1 | 1 | 1 | 1 | 1 |
| London | 4 | 2 | 5 | 2 | 2 |
| San Francisco | 5 | 4 | 2 | 6 | 3 |
| Los Angeles | 2 | 5 | 12 | 4 | 4 |
| Chicago | 6 | 18 | 3 | 8 | 5 |
| Singapore | 7 | 15 | 3 | 10 | 5 |
| Paris | 13 | 14 | 7 | 5 | 7 |
| Tokyo | 10 | 22 | 6 | 2 | 8 |
| Hong Kong | 3 | 3 | 10 | 25 | 9 |
| Washington DC | 12 | 10 | 7 | 13 | 10 |
| Sydney | 20 | 7 | 14 | 17 | 11 |
| Dallas | 9 | 6 | 35 | 9 | 12 |
| Boston | 24 | 13 | 21 | 7 | 13 |
| Houston | 8 | 15 | 29 | 14 | 14 |
| Miami | 19 | 8 | 19 | 20 | 14 |
| Atlanta | 20 | 10 | 24 | 15 | 16 |
| Beijing | 15 | 37 | 15 | 19 | 17 |
| Shanghai | 29 | 21 | 23 | 15 | 18 |
| Munich | 39 | 23 | 26 | 20 | 19 |
| Madrid | 52 | 25 | 9 | 24 | 20 |
| Melbourne | 44 | 15 | 25 | 26 | 20 |
Sources: Knight Frank, Macrobond, Wealth-X, New World Wealth, RCA, Oxford Economics, Five Star Alliance, Mastercard, Michelin, Times Higher Education, 2thinknow innovation cities index 2016-2017
Cities with the highest number of households earning US$250k+ (2017)
| City | Households |
| New York | 1,167,131 |
| Los Angeles | 637,749 |
| Chicago | 400,416 |
| San Francisco | 396,431 |
| Washington DC | 366,560 |
| Houston | 298,868 |
| Dallas | 297,970 |
| Boston | 293,276 |
| Philadelphia | 290,460 |
| London | 272,604 |
Source: Oxford Economics
Reasons for buying luxury investments
| 1 | Joy of ownership |
| 2 | Capital appreciation |
| 3 | Safe haven for capital |
| 4 | Investment portfolio diversification |
| 5 | Status among peers |
Source: The Wealth Report Attitudes Survey 2018
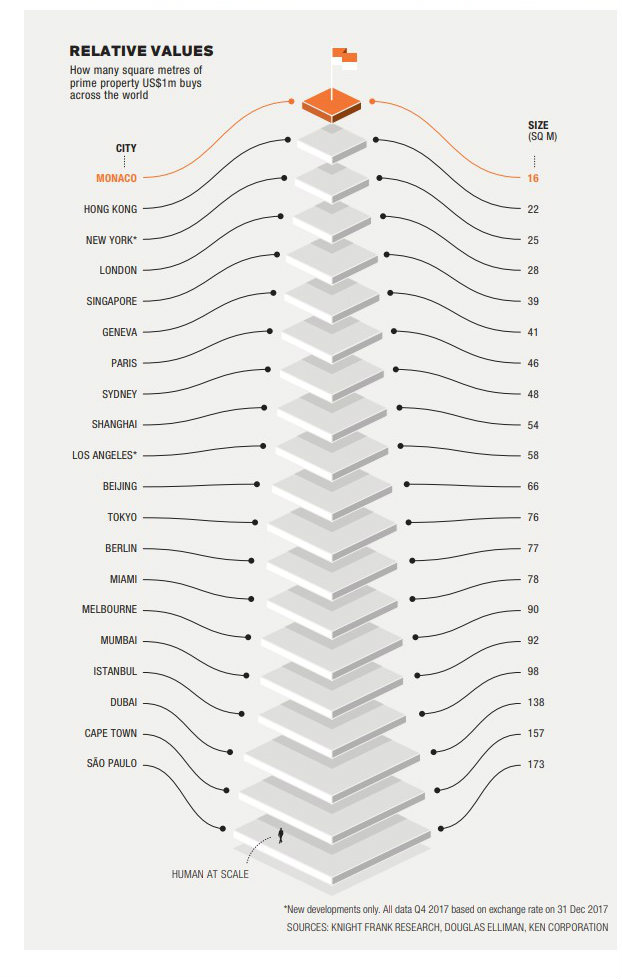
The square metres of luxury property US$1m will buy around the world:
Data as at December 2017
| City | Sqm per US$1m |
| Monaco | 16 |
| Hong Kong | 22 |
| New York* | 25 |
| London | 28 |
| Singapore | 39 |
| Geneva | 41 |
| Paris | 46 |
| Sydney | 48 |
| Shanghai | 54 |
| Los Angeles* | 58 |
| Bucharest | 250 |
*New developments only. All data Q4 2017 based on exchange rate on 31 Dec 2017
SOURCES: KNIGHT FRANK RESEARCH, DOUGLAS ELLIMAN, KEN CORPORATION
For further information, please contact:
Natalia Gross
Head of Marketing & Communications Romania
natalia.gross@ro.knightfrank.com
Ends
Notes to Editors
Knight Frank LLP is the leading independent global property consultancy. Headquartered in London, Knight Frank has more than 15,000 people operating from 418 offices across 60 markets. The Group advises clients ranging from individual owners and buyers to major developers, investors and corporate tenants. For further information about the Company, please visit www.knightfrank.com.